In a historic first, the Workplace Gender Equality Agency (WGEA) has released the median gender pay gaps of more than 5000 firms, highlighting the state of the gender pay gap across the Australian workforce.
This comes after the WGEA (Closing the Gender Pay Gap) Bill 2023 passed through Parliament on 30 March 2023 requiring employers with 100 or more workers to report on employee pay. It’s about time!!!
The 2022-23 WGEA Employer Census released on 27th February, captured data from 5,135 employer reporting groups, covering 4,822,194 employees.
Breakdown of Work Type
Women
Full-time 42.7%
Part-time 29.7%
Casual 27.6%
Men
Full-time 66.9%
Part-time 10.8%
Casual 22.3%
3% of CEOs work part-time, and the majority work full-time.
The result? More women work part-time or casually than men, while more men work full-time compared to women, which is not surprising.
Women are typically the primary caregivers and based on the figures, it’s clear that women still face barriers in the workplace.
Leadership
CEOs
Men 78%
Female 22%=
Managers
Men 58%
Women 42%
Non-managers
Men 48%
Women 52%
Women make up only 22% of the CEOs while 52% of the non-managers are women.
Disappointing? Yes! And, shows that women are very behind when it comes to leadership roles within companies. Why? Lack Of opportunity? Slower career progression? Lack of negotiation skills?
Industries Most Male-Dominated
Proportion of women in each industry and the proportion of women in management roles 2022-23
| Industry | Women | Women Managers | Women
KMPs |
Women CEOs |
| Mining | 22 | 23 | 23 | 8 |
| Construction | 26 | 19 | 20 | 6 |
| Electricity, Gas, Water and Waste Services | 26 | 25 | 28 | 4 |
| Transport, Postal and Warehousing | 26 | 27 | 27 | 8 |
| Manufacturing | 28 | 26 | 27 | 9 |
Women’s representation in mining, construction, electricity, transport, and manufacturing are the lowest out of any other industry.
Board Members Breakdown
Men 66%
Women 34%
Women make up only ⅓ of the board positions. This is slightly better than 5 years ago when women made up 27% of boards.
Gender Pay Gap
Average gender pay gap
| Year | Year Average total remuneration women | Average total remuneration men | Difference | Gender pay gap |
| 2022-23 | $95,165 | $121,558 | $26,393 | 21.7% |
| 2021-22 | $90,309 | $116,906 | $26,597 | 22.8% |
| 2020-21 | $87,451 | $113,237 | $25,786 | 22.8% |
| 2019-20 | $84,632 | $110,379 | $25,747 | 23.3% |
| 2018-19 | $80,983 | $106,814 | $25,831 | 24.2% |
2022-2023 saw a 1.1% decrease from the previous year and a 2.5% decrease from 5 years ago.
Median gender pay gap 2022-23
| Year | Median women | Median men | Difference | Gender pay gap |
| 2022-23 | $78,484 | $96,945 | $18,461 | 19.0% |
The median gender pay gap is slightly better than the average gender pay gap. An average higher than the median means that a disproportionate number of men in high-income roles has a greater impact on the gender pay gap than a disproportionate number of women in lower-paying roles.
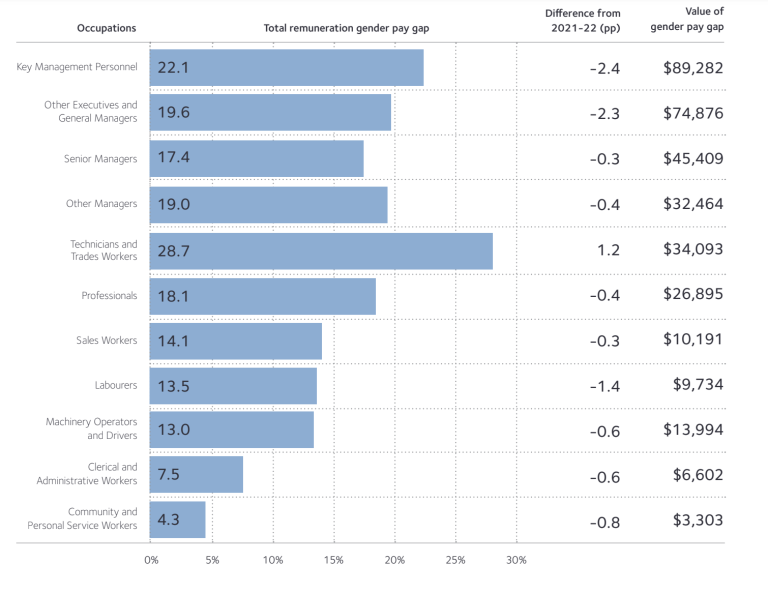
Total remuneration average gender pay gap by role 2022-23
- In 2022-23 the average total remuneration gender pay gap for non-managers was 18.1% and the median was 14.7%.
- The average total remuneration gender pay gap for managers was 22.2% and the median was 21.0%.
Employer Action
- 73% of employers had a gender pay gap of larger than 5% in favour of men.
- 20% of employers had a neutral gender pay gap (within +/- 5%).
- 7% of employers had a gender pay gap in favor of women.
The majority of employers have a pay gap that favors men over women.
Flexible Work
The proportion of employers with a flexible work policy or strategy has increased to a record high of 84%. Based on this increase, 92% of employees have access to flexible work policies or are covered by a flexible work strategy.
Employers with 5,000 or more employees in mixed-gender industries were the most likely to have a policy or strategy for flexible work. Small (100 to 499 employees) and medium-sized (500 to 4,999 employees) businesses in industries dominated by one gender were the least likely to have a policy.
Parental Leave
Proportion of employers offering paid primary carer’s or universally available parental leave by employer size 2022-23.
| Size | Portion |
| 5000+ | 87 |
| 1000-4999 | 76 |
| 500-999 | 66 |
| 250-499 | 62 |
| 100-249 | 57 |
The larger the company size is the more employees are offered paid primary care/parental leave.
Employee Consultation
Proportion of employers with a formal policy or strategy for consulting employees on gender equality 2022-23
31% Yes
69% No
Proportion of employers that consult employees about gender equality 2022-23
47% Yes
53% No
The majority of employers don’t consult their employees when it comes to creating policies about gender equality.
The numbers aren’t great and unfortunately, shows that women are progressing slower than men when it comes to salaries, career progression and possibility negotiation.
So, How can we do better? How can females fight harder for a seat at the table?
Iceberg, Melbourne’s go-to recruitment company! Specialising exclusively in recruiting for digital, marketing, PR, digital, experiential & advertising jobs. Permanent, freelance and contract roles available!. Sign up to our weekly newsletter HERE.


